Network meta-analysis
A standard (pairwise) meta-analysis pools studies that all compare the same two treatments — treatment A versus treatment B. Network meta-analysis extends this to three or more treatments at once, when the available studies compare different pairs of them (A vs. B, B vs. C, A vs. C, …), by combining that evidence into a single coherent analysis.
Direct and indirect evidence
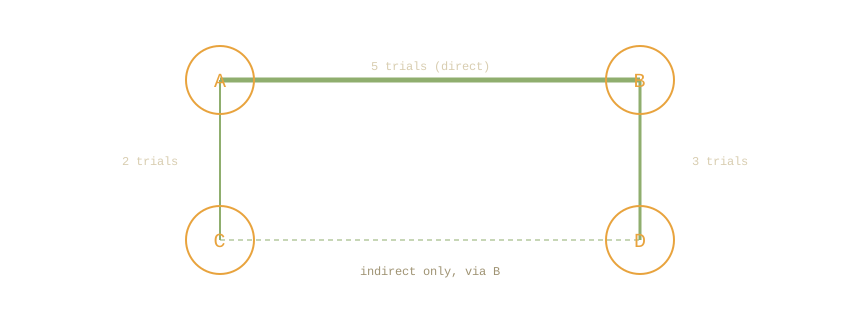
If no study directly compared A and C, but some compared A vs. B and others compared B vs. C, network meta-analysis can still estimate the A vs. C effect indirectly, through the shared comparator B. Where both direct and indirect evidence exist for the same pair, the two are combined into a single, more precise estimate.
The transitivity assumption
Combining direct and indirect evidence is only valid if the studies contributing to the network are similar enough in the factors that could affect the outcome (e.g., population, dosage, follow-up length) that indirect comparisons through a shared comparator are meaningful — this is called transitivity. Its statistical counterpart, checked after fitting the model, is consistency: direct and indirect estimates of the same comparison should agree; a significant disagreement (evaluated e.g. with the node-splitting method) signals that transitivity may not hold.
Outputs specific to network meta-analysis
- League table: a matrix summarizing the pooled effect (with confidence interval) for every pair of treatments, direct or indirect.
- Treatment ranking: probability-based rankings such as SUCRA (Surface Under the Cumulative Ranking curve) summarize, across all treatments, how likely each one is to be among the best.
- Network geometry: a diagram of which treatments have been directly compared and how much evidence connects them, useful for spotting which comparisons rest on indirect evidence alone.
Reporting
The PRISMA extension for network meta-analysis, PRISMA-NMA, adds reporting items specific to the network (geometry, transitivity assessment, ranking method) on top of the standard checklist — see PRISMA flow diagram and reporting guideline.